
Infographics are visual aids in the form of diagrams, charts, etc. used to summarize information. These are particularly beneficial to students who are visual learners. There are countless ways to use infographics in the classroom, such as course syllabii, pre-teaching a topic, review of key concepts, and announcements. Here are some powerful examples of using infographics in education:
1. Syllabii
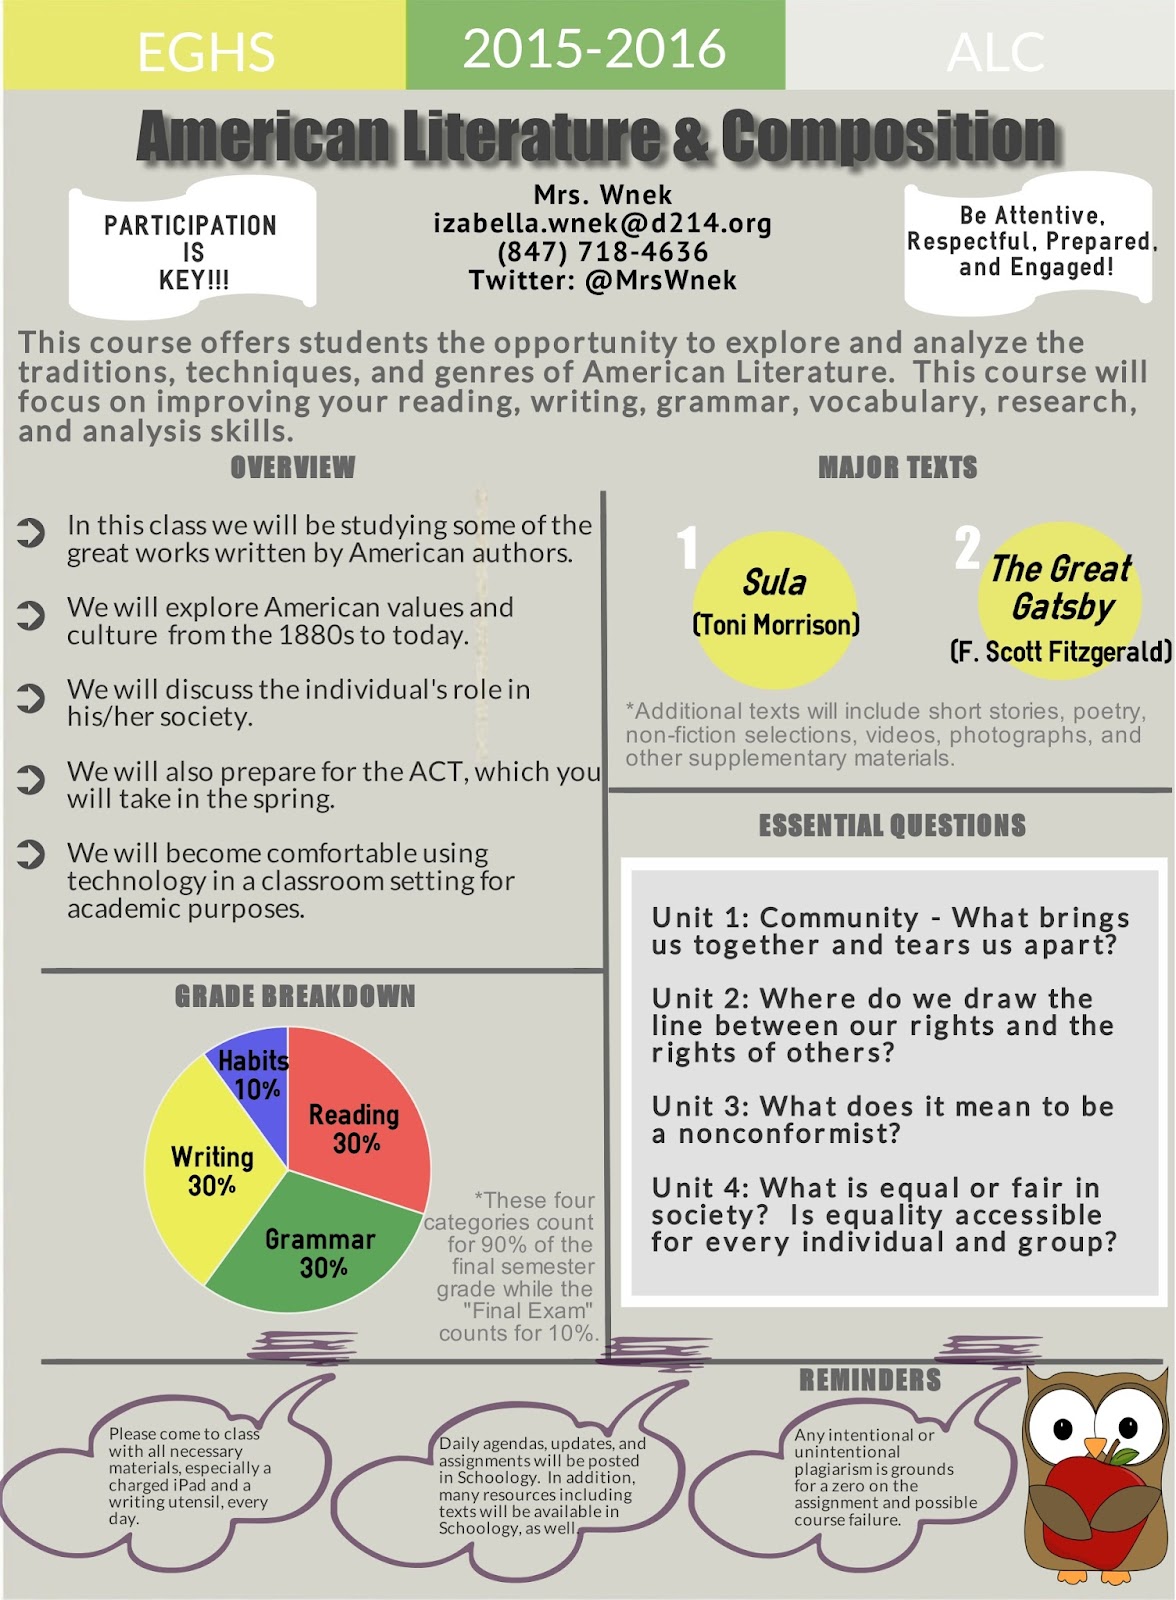
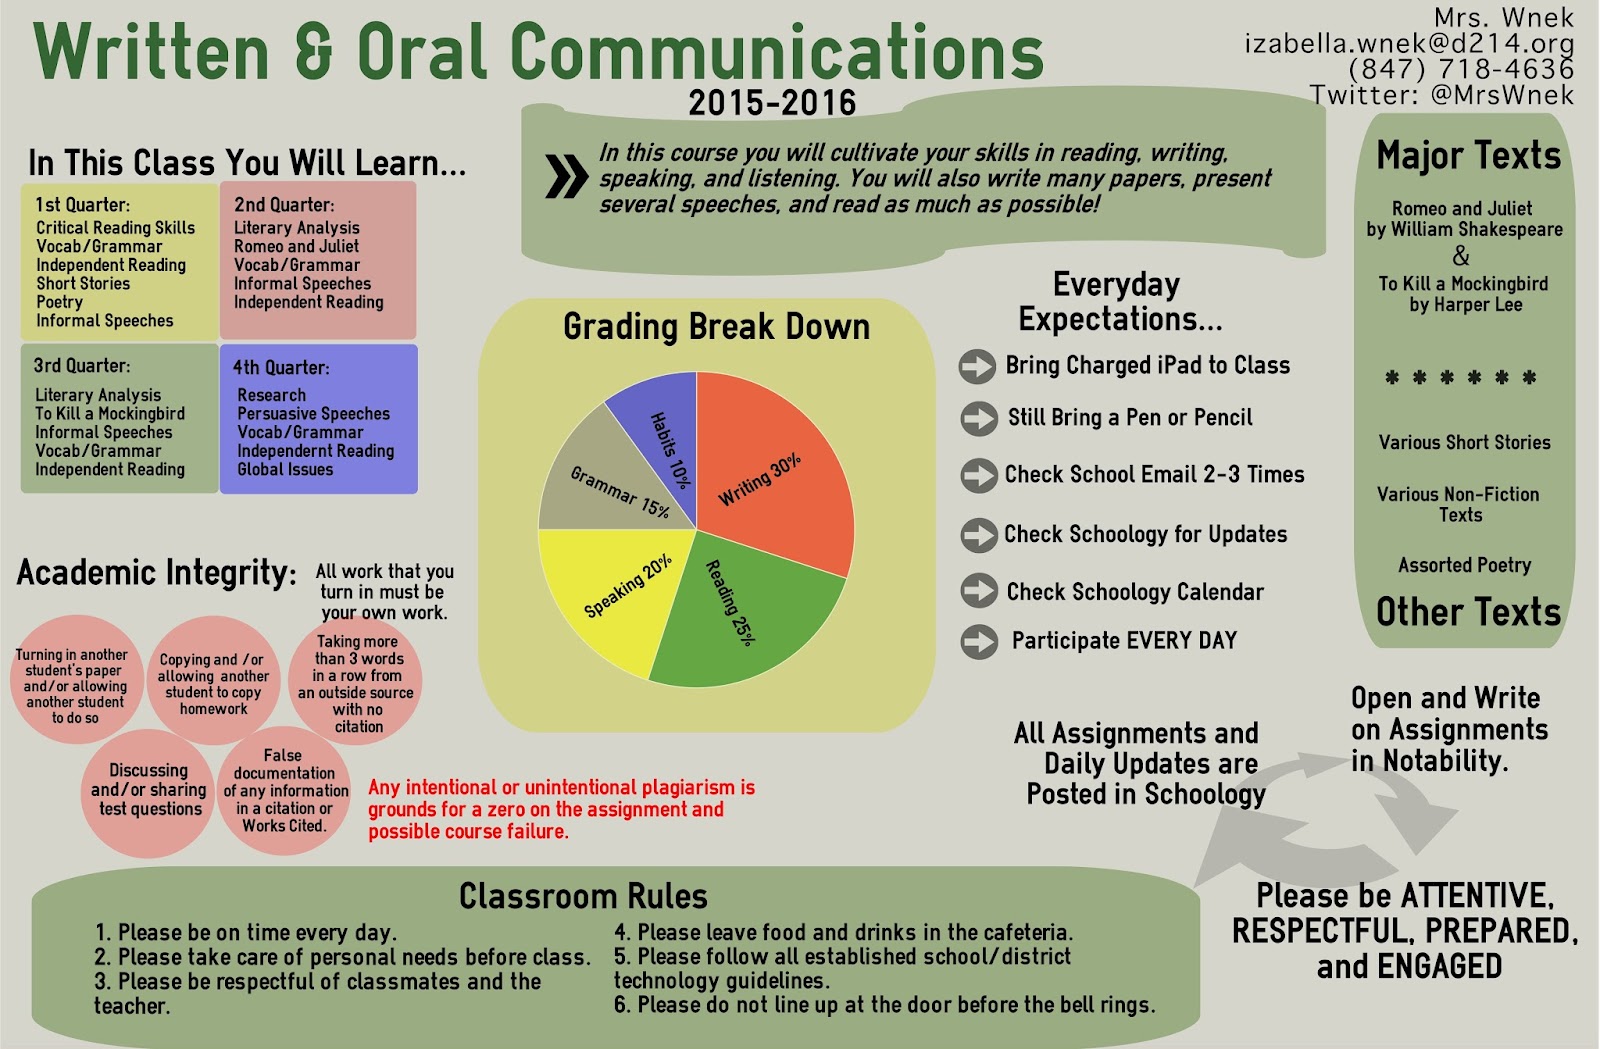
Infographics are a great way to spice up your syllabus and the first few days of class. Often times syllabi are long with a ton of information that students/parents will need throughout the year. An infographic is a great way to summarize the most important information in a visually appealing graphic. During the first week, when Chris Cirrincione went through the syllabus, he used the infographic instead. Chris then posted the infographic to his Schoology course and referred back at various times, including Open House.
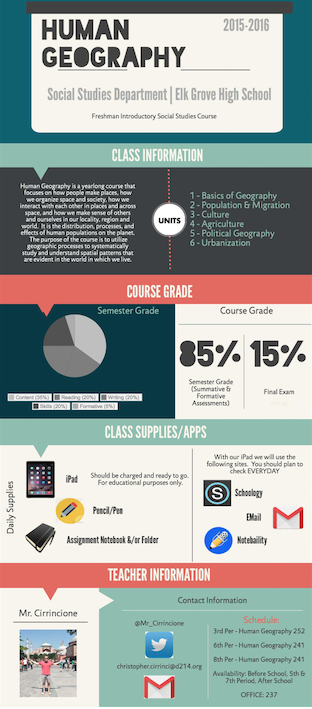


Infographics not only summarize important information, but also appeal to more visual learners, who often lose interest quickly when reading through a long, and often boring, syllabus. English Language Learners, and students with learning disabilities and other special needs, also appreciate a more interactive and engaging alternative to the traditional syllabus. When using the infographic, Izabella Wnek noticed a marked increase in students who are willing to volunteer to read aloud in front of the class. The simplified language, short pieces of text, and visual aids, promote understanding in all students. In addition to reviewing the infographic in place of reading through a syllabus and posting it to Schoology, Izabella also created a poster of the infographic for the classroom that will be available for students to refer to all year long.
2. Portfolio or Biography
As a case manager, Katie Winstead used to conference with all of her students at the beginning of the year and hand them a letter to keep and share with their parents. Out of the 20+ students she case manages, she would only have 1-2 of them in my classes, so the letter provided a great way for them to get to know her, where to find her, and what she was there for. The letter would often get lost, and students would ask her throughout the year when they could come to see her (either during the day or after school). Last year, she started sending it in an email - but it was still so much information for students to read, process, and remember. This year she decided to make an infographic to send out to all her students and parents when she conferenced with them. It's been great because students star the email (for easy access), have her picture on it (which is especially helpful for students who have difficulties with eye contact and remembering faces), and the information is much more visual and accessible to students.

3. Review of Key Topics
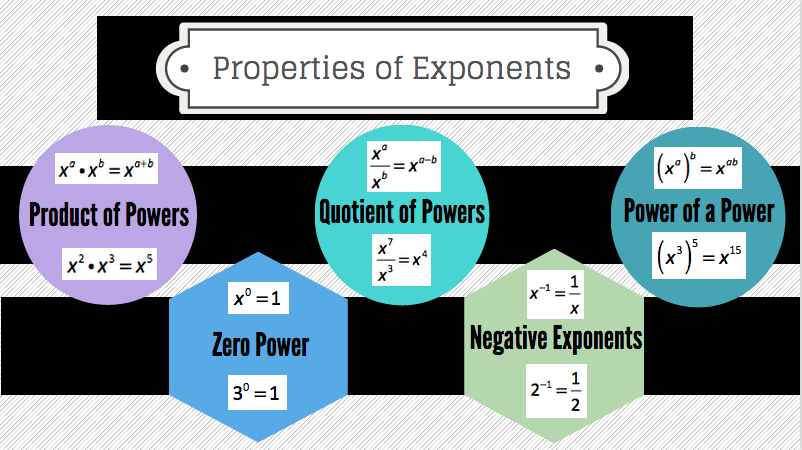
Infographics can be used to succinctly display key formulas, relationships, or
concepts for students. The visual aspect of it helps students to categorize relationships or view a hierarchy of ideas. Rachel Barry uses the example below as a review guide for exponents, providing students with both a rule and an example in a simple graphic.
4. Announcements
An announcement can be made more visually appealing through the use of an infographic maker. Some provide free layouts that can be edited quickly to spice up a simple announcement. Here are examples that Katie Owen, Linda Ashida, and Rachel Barry created to announce professional development opportunities with our staff.


How do you make an infographic?
There are a series of online sites devoted to infographics for the most novice to the more advanced. Many of these sites, such as PiktoChart, have a series of pre-made infographics that you can manipulate. If you are more adventitious you can start from scratch and create your own, but they are as easy to make as designing a powerpoint slide.
Easel.ly is another website that provides vhemes (visual themes) and templates to create infographics. Users can upload files and manipulate their visuals to their liking. Furthermore, users are able to check out public visuals that have already been created for inspiration, and even create groups that a whole team/PLC can join. This way, visuals created by any group member can be used by the entire team. However, if you are the only one who has jumped on the infographic boat (for now), you can easily provide a shareable link to interested parties.
Please feel free to stop by the Collab Lab if you would like some help in creating an infographic!
A blog must be connected to the person in need. It is really important to understand the actual feel of such necessity and the essence of objective behind it. Author must give proper time to understand every topic before writing it.
ReplyDeleteติว igcse ที่ไหนดี
Regular visits listed here are the easiest method to appreciate your energy, which is why why I am going to the website everyday, searching for new, interesting info. Many, thank you Read the reviews
ReplyDeleteEducation is the way toward learning and securing information at school from an educator, accepting learning at home from a parent, a relative, and even a colleague.Music Academy
ReplyDeleteI am extremely delighted in for this web journal. Its a useful subject. It help me all that much to take care of a few issues. Its chance are so awesome and working style so rapid. FinQuiz
ReplyDeleteStudies will turn out to be exceptionally simple. Science and innovation will assume a critical job in future training yet it won't decrease the significance of educator. An educator is the fundamental guide in the entire existence of an understudy.Take my online class
ReplyDelete